Please use this identifier to cite or link to this item:
https://doi.org/10.21256/zhaw-29341| Publication type: | Master thesis |
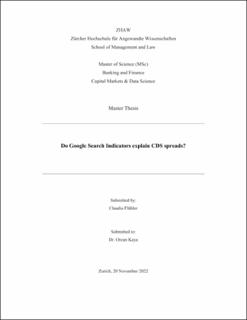
| Title: | Do Google Search Indicators explain CDS spreads? |
| Authors: | Flühler, Claudia |
| Advisors / Reviewers: | Kaya, Orcun |
| DOI: | 10.21256/zhaw-29341 |
| Extent: | 59 |
| Issue Date: | 2022 |
| Publisher / Ed. Institution: | ZHAW Zürcher Hochschule für Angewandte Wissenschaften |
| Publisher / Ed. Institution: | Winterthur |
| Language: | English |
| Subject (DDC): | 005: Computer programming, programs and data 332: Financial economics |
| Abstract: | Over the last decade, technological development has allowed us to retrieve large economic data sets from various sources such as social media, internet search engines, and electronic transaction sources. Economists have constructed methods to use this new alternative data to monitor macroeconomic conditions in almost real time. Including these alternative data was found to improve the nowcast performance in many macroeconomic cases. In addition, a considerable number of successful attempts have been made to predict financial markets with data collected from online search engines. However, there is a lack of literature covering the relevance of internet search statistics for the assessment of credit risk. The purpose of this thesis is to determine if Google-based indicators exhibit predictive power on Credit Default Swaps spreads of large Swiss companies. Credit Default Swaps prices reflect the perceived credit or default risk of the underlying entity. A quantitative analysis is conducted by running multiple OLS regression models to answer the research question. Credit Default Swap spread changes of large Swiss companies are regarded as the dependent variable. The independent variables of the regression analyses are three Google-based indicators from the website trendEcon and three control variables. The three independent variables from trendEcon are the index of Perceived Economic Situation, the index of Mobility, and the Clothing and Shoes indicator. The three control variables are the SMI returns, the two-year Swiss Government Bond Yields, and the stock market volatility index VSTOXX. In a first step, multiple regression models are run on a panel data set of the overall sample. The period of the analysis lasts from August 2, 2017, to August 29, 2022, with a total of 19’110 observations. In a second step, individual OLS regressions are run on the series of each company in the sample. The results of the panel data regression show that the Google-based indicators from trendEcon perform well in capturing developments in Credit Default Swap spread changes on the whole sample. The coefficient of determination (R2) of the regression models increases when trendEcon variables are included. Especially the index of Perceived Economic Situation and Clothing and Shoes exhibit significant results, and the directions of relation show the expected negative signs. However, the coefficients are rather low, indicating that the relationship between the two trendEcon variables and Credit Default Swaps is rather weak. The Mobility indicator is also statistically significant, but the nature of the relationship is not in accordance with theoretical assumptions. The results of the single-company regression models are, however, somewhat mixed across the companies. The coefficient of determination (R2) of the single company regression models is indeed slightly higher when the trendEcon variables are included. However, some regression models show poor results with regard to the coefficient of determination (R2) for certain companies, which seems to be related to the industry the company is operating in. Among the three trendEcon variables, the indicator of Clothing and Shoes (CS) shows the best capability to explain CDS spread changes of Swisscompanies in the sample. None of the estimated coefficients of the Mobility indicator exhibit significance in the single-company regression models. The results of the quantitative analysis imply that the Google-based indicators from trendEcon have the ability to explain CDS spread changes of Swiss companies, however, the impact is rather small. In that regard, this thesis lays the foundation for further empirical research in this field. The expansion of the analyses by including Google-based indicators using other keywords to examine credit risks contains great potential. Further, over time, more data will be available for certain keywords and areas, which increases the ability to create even better representations of sentiments captured from Google search volumes. |
| URI: | https://digitalcollection.zhaw.ch/handle/11475/29341 |
| License (according to publishing contract): | CC BY-NC-ND 4.0: Attribution - Non commercial - No derivatives 4.0 International |
| Departement: | School of Management and Law |
| Appears in collections: | MSc Banking and Finance |
Files in This Item:
| File | Description | Size | Format | |
|---|---|---|---|---|
| 2022_Flühler_CLaudia_MSc_BF.pdf | 1.51 MB | Adobe PDF |  View/Open |
Show full item record
Flühler, C. (2022). Do Google Search Indicators explain CDS spreads? [Master’s thesis, ZHAW Zürcher Hochschule für Angewandte Wissenschaften]. https://doi.org/10.21256/zhaw-29341
Flühler, C. (2022) Do Google Search Indicators explain CDS spreads? Master’s thesis. ZHAW Zürcher Hochschule für Angewandte Wissenschaften. Available at: https://doi.org/10.21256/zhaw-29341.
C. Flühler, “Do Google Search Indicators explain CDS spreads?,” Master’s thesis, ZHAW Zürcher Hochschule für Angewandte Wissenschaften, Winterthur, 2022. doi: 10.21256/zhaw-29341.
FLÜHLER, Claudia, 2022. Do Google Search Indicators explain CDS spreads? Master’s thesis. Winterthur: ZHAW Zürcher Hochschule für Angewandte Wissenschaften
Flühler, Claudia. 2022. “Do Google Search Indicators Explain CDS Spreads?” Master’s thesis, Winterthur: ZHAW Zürcher Hochschule für Angewandte Wissenschaften. https://doi.org/10.21256/zhaw-29341.
Flühler, Claudia. Do Google Search Indicators Explain CDS Spreads? ZHAW Zürcher Hochschule für Angewandte Wissenschaften, 2022, https://doi.org/10.21256/zhaw-29341.
Items in DSpace are protected by copyright, with all rights reserved, unless otherwise indicated.