Please use this identifier to cite or link to this item:
https://doi.org/10.21256/zhaw-28383Full metadata record
| DC Field | Value | Language |
|---|---|---|
| dc.contributor.author | Farahani, Ali Mazraeh | - |
| dc.contributor.author | Adibi, Peyman | - |
| dc.contributor.author | Ehsani, Mohammad Saeed | - |
| dc.contributor.author | Hutter, Hans-Peter | - |
| dc.contributor.author | Darvishy, Alireza | - |
| dc.date.accessioned | 2023-08-04T08:43:37Z | - |
| dc.date.available | 2023-08-04T08:43:37Z | - |
| dc.date.issued | 2023 | - |
| dc.identifier.issn | 2169-3536 | de_CH |
| dc.identifier.uri | https://digitalcollection.zhaw.ch/handle/11475/28383 | - |
| dc.description.abstract | Automated chart analysis has vast potential to improve the accessibility of charts for a wider audience, e.g., people with visual impairments or other disabilities, by generating captions for chart images that can quickly convey the information being represented. Additionally, it can improve the performance of automatic document analysis systems, by enabling them to extract valuable information from the documents with graphical/visual scientific content. Although recent advancements in modality translation and multi-modal learning have led to the development of more or less successful image captioning and visual question-answering methods, but most of them have been designed for general images, and cannot be successfully applied to specific areas such as medical images or scientific charts and graphs. Therefore, further research is necessary to develop automated chart analysis methods that can be effectively applied to these specific areas. In this paper, a comprehensive review of chart analysis methods is presented. The review covers a wide range of chart types, including line charts, bar charts, scatter plots, and includes an in-depth analysis of each method. Additionally, this paper provides a more extensive coverage of chart analysis methods compared to previous studies, making it a valuable resource for researchers and practitioners in the field. Various techniques can be categorized from different aspects, such as chart type, model architecture, learning algorithm, visual feature space, and language modeling. In this paper, different methods are classified from a more technical viewpoint, by considering the approach used for modeling the problem. A taxonomy is proposed which divides the methods into three major categories: rule-based, chart captioning, and chart question-answering approaches. The rule-based approach uses the classical knowledge representation methods for reasoning, which has been diminished by the emergence of deep learning models. Chart captioning provides a general summary of the information conveyed by a chart through recent modern learning methods but may miss some detailed information which may be of special interest. On the other hand, the question answering allows for a direct response to a more specific user question by combining image analysis and text understanding techniques. Finally, the existing challenges and the potential research directions of the interesting chart understanding problem are discussed. | de_CH |
| dc.language.iso | en | de_CH |
| dc.publisher | IEEE | de_CH |
| dc.relation.ispartof | IEEE Access | de_CH |
| dc.rights | http://creativecommons.org/licenses/by/4.0/ | de_CH |
| dc.subject | Visual question answering | de_CH |
| dc.subject | Multi-modal learning | de_CH |
| dc.subject | Modality translation | de_CH |
| dc.subject | Automated chart analysis | de_CH |
| dc.subject | Image captioning | de_CH |
| dc.subject | Data mining | de_CH |
| dc.subject | Optical character recognition | de_CH |
| dc.subject | Visualization | de_CH |
| dc.subject | Multisensory integration | de_CH |
| dc.subject.ddc | 006: Spezielle Computerverfahren | de_CH |
| dc.title | Automatic chart understanding : a review | de_CH |
| dc.type | Beitrag in wissenschaftlicher Zeitschrift | de_CH |
| dcterms.type | Text | de_CH |
| zhaw.departement | School of Engineering | de_CH |
| zhaw.organisationalunit | Institut für Informatik (InIT) | de_CH |
| dc.identifier.doi | 10.1109/ACCESS.2023.3298050 | de_CH |
| dc.identifier.doi | 10.21256/zhaw-28383 | - |
| zhaw.funding.eu | No | de_CH |
| zhaw.originated.zhaw | Yes | de_CH |
| zhaw.pages.end | 76221 | de_CH |
| zhaw.pages.start | 76202 | de_CH |
| zhaw.publication.status | publishedVersion | de_CH |
| zhaw.volume | 11 | de_CH |
| zhaw.publication.review | Peer review (Publikation) | de_CH |
| zhaw.webfeed | Human-Centered Computing | de_CH |
| zhaw.author.additional | No | de_CH |
| zhaw.display.portrait | Yes | de_CH |
| Appears in collections: | Publikationen School of Engineering | |
Files in This Item:
| File | Description | Size | Format | |
|---|---|---|---|---|
| 2023_Farahani-etal_Automatic-chart-understanding-a-review_IEEE-Access.pdf | 2.25 MB | Adobe PDF | 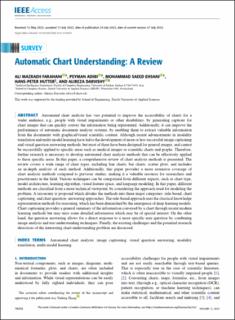 View/Open |
Show simple item record
Farahani, A. M., Adibi, P., Ehsani, M. S., Hutter, H.-P., & Darvishy, A. (2023). Automatic chart understanding : a review. IEEE Access, 11, 76202–76221. https://doi.org/10.1109/ACCESS.2023.3298050
Farahani, A.M. et al. (2023) ‘Automatic chart understanding : a review’, IEEE Access, 11, pp. 76202–76221. Available at: https://doi.org/10.1109/ACCESS.2023.3298050.
A. M. Farahani, P. Adibi, M. S. Ehsani, H.-P. Hutter, and A. Darvishy, “Automatic chart understanding : a review,” IEEE Access, vol. 11, pp. 76202–76221, 2023, doi: 10.1109/ACCESS.2023.3298050.
FARAHANI, Ali Mazraeh, Peyman ADIBI, Mohammad Saeed EHSANI, Hans-Peter HUTTER und Alireza DARVISHY, 2023. Automatic chart understanding : a review. IEEE Access. 2023. Bd. 11, S. 76202–76221. DOI 10.1109/ACCESS.2023.3298050
Farahani, Ali Mazraeh, Peyman Adibi, Mohammad Saeed Ehsani, Hans-Peter Hutter, and Alireza Darvishy. 2023. “Automatic Chart Understanding : A Review.” IEEE Access 11: 76202–21. https://doi.org/10.1109/ACCESS.2023.3298050.
Farahani, Ali Mazraeh, et al. “Automatic Chart Understanding : A Review.” IEEE Access, vol. 11, 2023, pp. 76202–21, https://doi.org/10.1109/ACCESS.2023.3298050.
Items in DSpace are protected by copyright, with all rights reserved, unless otherwise indicated.